Summary Dashboard
Nerdio Manager's Summary Dashboard displays summary information about usage and savings in all the workspaces or AVD tenants. The Summary Dashboard allows you to view the summary information, drill down to view details, and export usage and savings data in a CSV file.
To view the summary dashboard:
-
Navigate to Dashboard.
-
Select either All workspaces or All AVD tenants.
-
In Time Range, select the desired time range to display.
The following information is displayed:
-
Auto-Scale Savings: This is the savings from auto-scaling over the selected period of time. The costs are based on Azure pay-as-you-go list prices. Static host pool information is not included.
-
Savings: Select the information icon
 to see host pool, file share, and NetApp Files savings information.
 -
Named user cost: This is the projected per-named user monthly cost taking into account the auto-scale savings. This is based on Azure pay-as-you-go list prices.
-
Concurrent user cost: This is the projected per-concurrent user monthly cost taking into the account auto-scale savings. This is based on Azure pay-as-you-go list prices.
-
Monthly active user cost: This is the calculated active user monthly cost taking into account auto-scale savings. This is based on Azure pay-as-you-go list prices. Static host pool information is not included.
-
-
Current Host Pools Counts: This is a summary of the host pools and session hosts, broken down by the type of desktop experience.
-
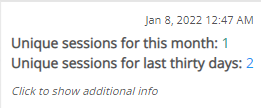
Hover: You can hover over any part of any graph to see its details. For example:

-
Select any point on any graph to display the Usage Details window. These are the details for the Workspaces or Tenants at the selected point in time.
-
Select Export details to export a usage details CSV file to your browser's default download folder.
-
-
Select export: At the bottom of the dashboard, select Select export to export the desired report as a CSV file into your browser's default download folder.